
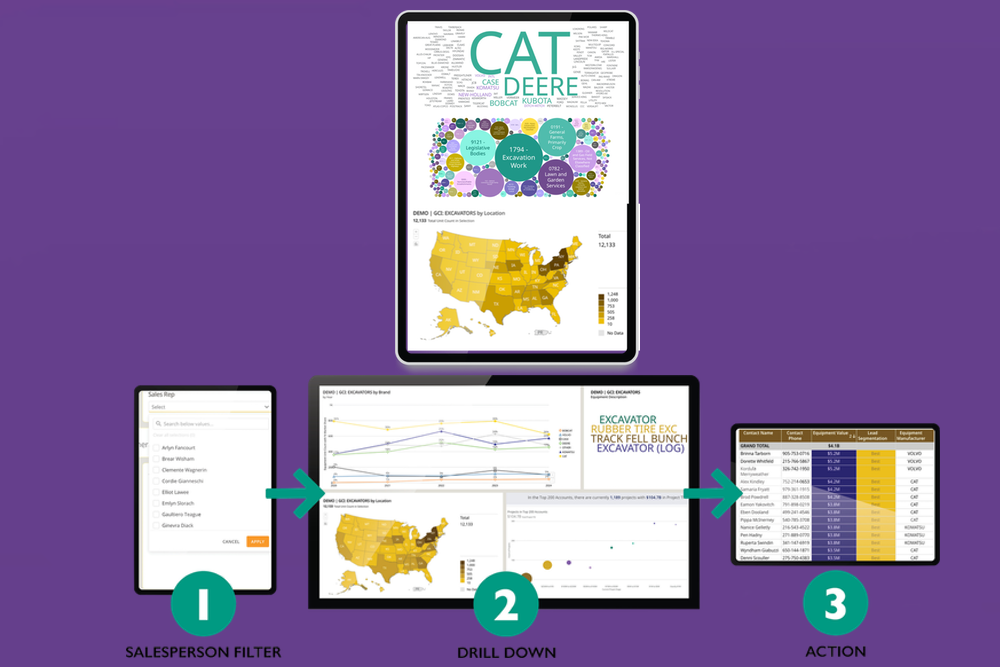


Your Best Quarter is 3 Clicks Away
Prospect Intelligence Platform with a Data Science Assistant
Lead(er) digs into construction spending, machine populations and other critical market intel to tracks participation rates, and delivers practical, equipment-focused insights in three clicks.
The outcome: reps quote more deals and boost close rates by up to 30%. It’s like having product manager fused with a salesperson who knows excavators, rental fleets, and your market inside out, improving hyper-personalized selling by 5-10× compared to current methods.
Case Study: Leading CE Dealer Boosted Participation Rates and Market Share
At a Glance:
A mid-sized construction equipment dealer operating eight locations across the Midwest, sought to strengthen its position in a highly competitive market dominated by giants like Caterpillar and Case Construction. Despite a dedicated sales team, Peak struggled with inconsistent participation rates, limited visibility into market opportunities, and a reliance on outdated, siloed data systems.
Lead(er) transformed its sales strategy, achieving a 15% increase in participation rates and unlocking significant market share gains.
Challenge:
Peak Equipment Solutions faced several obstacles that hindered its ability to compete effectively:
- Fragmented Data Systems: customer and prospect data was scattered across multiple platforms (CRM, ERP, and legacy spreadsheets), making it nearly impossible to get a unified view of market opportunities.
- Unclear Participation Rates: leadership could not accurately measure how effectively the sales team was engaging with high-potential customers, leading to missed opportunities and inefficient resource allocation.
- Aging Equipment Blind Spots: without insight into equipment replacement cycles, reps often overlooked prospects ready to upgrade or service equipment, losing sales to competitors and hampering their dealership’s absorption rate..
- Time-Intensive Processes: Sales reps spent hours manually compiling prospect lists and analyzing market trends, leaving little time for strategic selling.
“We were guessing at our participation rate and hoping our efforts would pay off,” said Sarah M, Regional Sales Manager. “We needed hard data to tell us where to focus.”
Spoiler Alert:
Lead(er) delivered measurable improvements:
- 15% Increase in Participation Rates: by tracking underperforming territories and scoring opportunities within each, high-potential accounts were prioritized and tracked, boosting participation rates within three months.
- Market Share Growth: analysis revealed that 22% of opportunities accounted for 68% of market outcomes. Refocusing efforts on these high value opportunities, combined with new prospect outreach, drove a significant market share increase.
- 30% More PSSR (product support sales representative) Opportunities Identified: the aging equipment algorithm highlighted 30% more opportunities, enabling reps to close deals 5× faster than before.
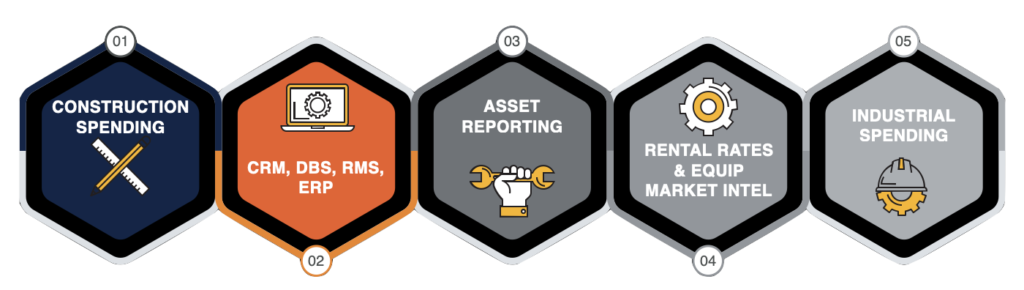
Your data combined, cleansed, structured, and enriched